ECharts Overview
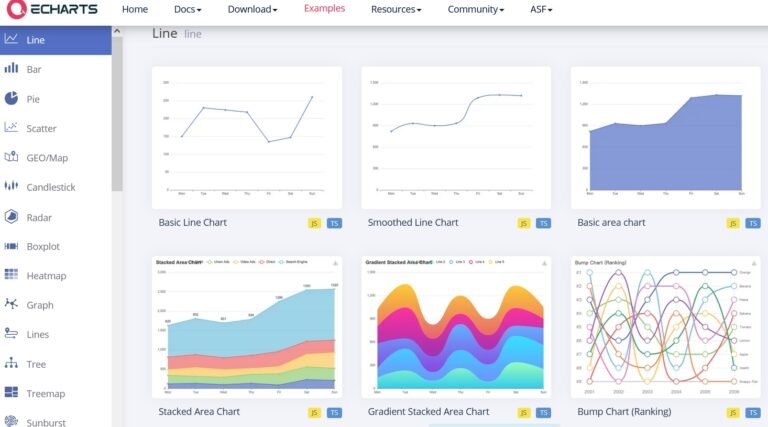
ECharts is an open-source visualization library based on JavaScript, offering a rich variety of chart types and flexible configuration options that help developers create beautiful and powerful data visualizations on web pages. You can see examples of various line charts, which demonstrate how to create basic line charts, line charts with smooth curves, multi-series line charts, and line charts with a timeline using ECharts.
ECharts Highlights
Rich Chart Types: ECharts offers various types of line charts, including basic line charts, area charts, stacked line charts, and more, catering to different data visualization needs.
Flexible Configuration: Users can customize the appearance of charts through detailed configuration options, including line styles, colors, axes, legends, and tooltip information.
Interactivity: ECharts line charts support rich interactive features such as data zooming, dragging, and click events, enhancing the user experience.
Animation Effects: The charts have smooth animation effects when loading and updating data, making data changes more intuitive.
Responsive Design: ECharts charts automatically adapt to different container sizes, ensuring good display effects on various devices and resolutions.
Data-Driven: ECharts supports the generation of charts through data-driven methods, meaning you can dynamically change the content of the chart by updating the data source.
Theme Support: ECharts provides a variety of preset themes, which users can easily switch between or customize to fit their brand style.
Internationalization: ECharts supports multiple languages, making it easy to display chart information in the appropriate language for users from different regions.